
Overlay site plans and project drawings onto satellite maps to create a real-world view of your project.
Most projects start with a plan.
Designs are created, layouts are approved and drawings become the primary source of information for field teams. The challenge is that drawings often exist separately from the physical location they represent. Teams find themselves switching between PDFs, paper plans, aerial imagery and site visits just to understand where something is meant to be located.
Site Plan Overlays bridges the gap between project drawings and the real world.
Instead of viewing a drawing in isolation, users can place plans directly onto a satellite map and align them with real-world coordinates. This creates a visual connection between design information and the physical environment, making it easier to understand how plans relate to actual site conditions.
Whether working with construction layouts, utility designs, environmental plans, survey information or infrastructure drawings, overlays provide a level of context that traditional plans cannot deliver on their own.
A drawing may show what is planned, but it often lacks geographic context.
Without a map reference, it can be difficult to understand surrounding infrastructure, neighbouring properties, environmental features, access routes or existing site conditions. Teams are often required to compare multiple information sources to build a complete picture of the project environment.
By overlaying plans directly onto satellite imagery, users can immediately see how design information fits within the broader landscape.
This helps teams identify site constraints, verify locations, improve planning accuracy and better understand project impacts before work begins.
Projects change.
Site conditions evolve, assets are relocated, construction progresses and information is updated throughout the project lifecycle. One of the most valuable aspects of Site Plan Overlays is the ability to compare planned information against real-world conditions.
Users can adjust overlay transparency to switch between drawing information and satellite imagery. This makes it easy to compare proposed layouts against existing conditions, validate completed works and understand how a site changes over time.
Instead of relying solely on drawings or relying solely on maps, teams can use both together.
Site plans are often viewed by many different stakeholders.
Project managers, engineers, contractors, surveyors, environmental consultants and field crews all rely on drawing information to perform their work. Site Plan Overlays creates a shared visual environment where everyone can view the same information within the same geographic context.
When combined with map elements, GPS linked records and markups, overlays become more than a drawing viewer. They become a central workspace for planning, communication and project documentation.
Display construction plans directly on satellite imagery.
Visualise underground and above-ground infrastructure.
Reference survey information within its geographic location.
Overlay environmental boundaries and management areas.
Provide geographic context to engineering designs.
Compare planned works against existing assets and site conditions.
Visualise asset locations against site layouts and plans.
Compare completed works with original designs.
A site plan overlay is a project drawing or plan that has been aligned and displayed on top of a satellite map.
They help users understand how drawings relate to real-world locations and existing site conditions.
Construction plans, engineering drawings, utility layouts, survey plans, environmental plans and many other project drawings.
Yes. Users can adjust transparency to compare drawing information against satellite imagery.
Yes. Plans are aligned to real-world coordinates and displayed geographically.
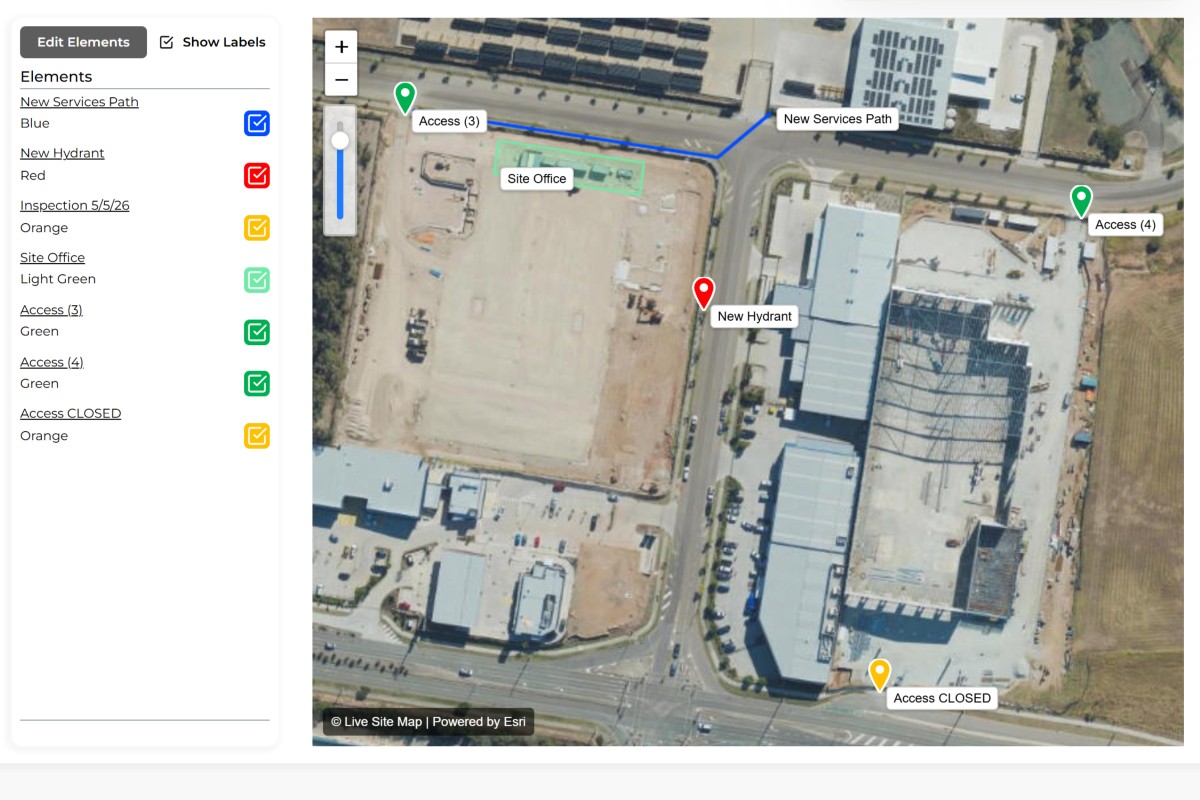
Yes. Elements, records and markups can all be displayed alongside site plan overlays.
Construction companies, engineers, utilities, environmental consultants, surveyors and infrastructure operators commonly use overlays.
They provide geographic context, making it easier to visualise designs, site conditions and project information together.


.jpg)
1234.png)