Live Site Map helps geotechnical engineers manage field records, borehole locations, test pits, sampling points, site observations, photos and investigation data in one shared visual workspace. Connect information to maps and plans so everyone knows what it is and where it is.

See how Live Site Map helps geotechnical engineers manage boreholes, test pits, site observations, photos and investigation records across a project site.
Before reports are written, designs are developed or recommendations are made, geotechnical engineers collect information from specific locations.
A borehole.
A test pit.
A dynamic cone penetration test.
A groundwater monitoring point.
A sampling location.
A slope inspection point.
A site observation.
The location is often just as important as the information collected.
Without location context, field information loses much of its value.
This is why maps, plans and site layouts play such a central role throughout geotechnical investigations.
A typical investigation may involve dozens of locations and hundreds of individual records.
Field notes.
Photographs.
Borehole logs.
Test pit records.
Sampling information.
Groundwater observations.
Laboratory references.
Site instructions.
Marked-up plans.
As projects become larger, keeping this information organised becomes increasingly difficult.
The challenge is not collecting data.
The challenge is maintaining a clear connection between the information and the location where it was gathered.
A geotechnical investigation is rarely a collection of isolated test locations.
Engineers need to understand how information relates across an entire site.
Where are the boreholes located relative to the proposed building?
Which test pits were completed within future road corridors?
Where were groundwater observations recorded?
Which areas were inaccessible during the investigation?
How does the investigation relate to the proposed development layout?
Answering these questions often requires teams to move between drawings, maps, reports and field records.
Bringing this information together visually provides a clearer understanding of site conditions.
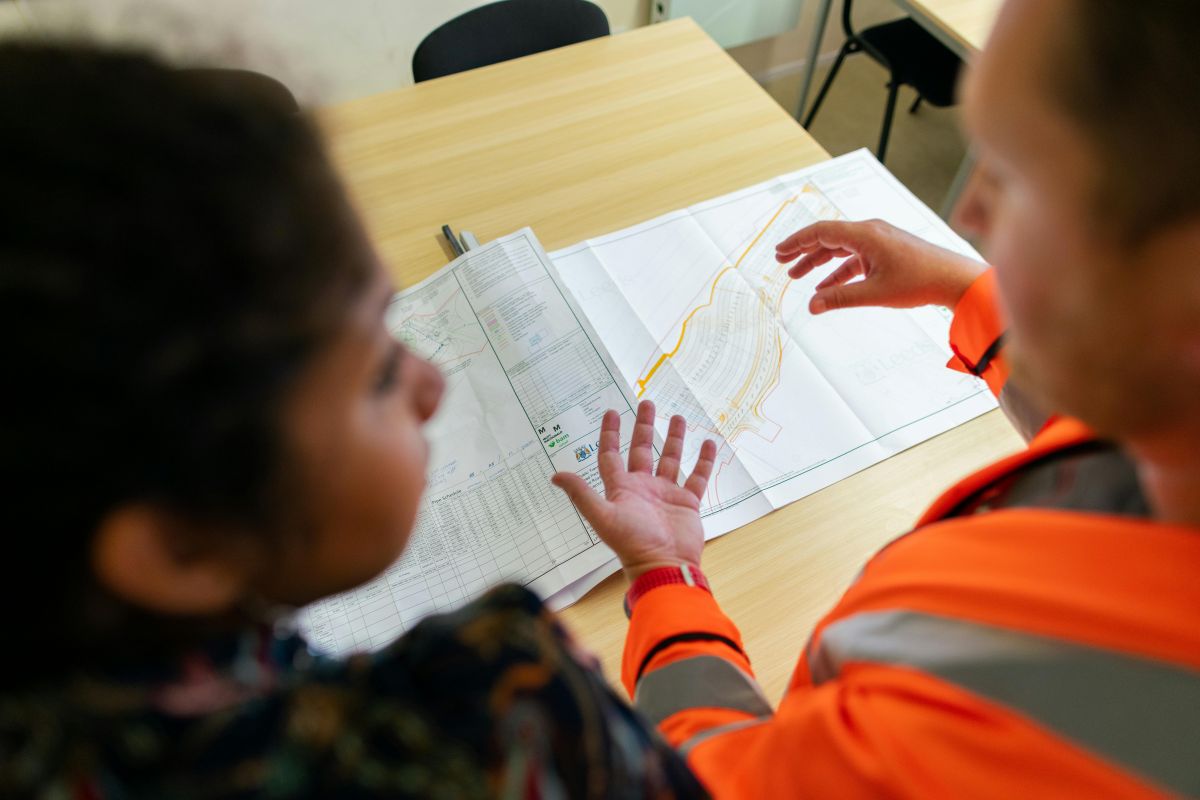
Most project discussions eventually return to a plan.
Clients review plans.
Field crews work from plans.
Engineers mark up plans.
Developers assess constraints on plans.
The problem is that supporting information is often stored somewhere else.
Photos may sit in folders.
Field observations may be stored in spreadsheets.
Investigation notes may be buried inside reports.
When information is linked directly to plan overlays, teams can quickly understand both the location and the supporting records.
Investigation locations form the backbone of most geotechnical projects.
These locations often need to be referenced long after field work has been completed.
Future stages may require additional testing.
Clients may request clarification.
Design teams may seek supporting information.
Additional investigations may be undertaken years later.
Having a clear visual record of investigation locations helps project teams quickly understand where previous work occurred and what information was collected.
Not every important finding appears within a formal test result.
Ground conditions.
Access constraints.
Evidence of fill.
Surface water observations.
Existing infrastructure.
Unexpected site conditions.
These observations frequently influence project decisions.
Unfortunately, they are often recorded in notebooks, emails or disconnected field records.
Linking observations directly to investigation locations helps preserve important project context.
Many geotechnical projects begin long before construction starts.
Sites may be undeveloped.
Roads may not yet exist.
Survey information may still be limited.
Satellite imagery often provides the best available visual reference during early project stages.
Being able to view investigation records alongside satellite imagery helps engineers understand how information relates to the broader site.
This is particularly useful for large developments, infrastructure corridors, industrial facilities and greenfield projects.
One of the biggest advantages of plan overlays is the ability to compare field information against future works.
Proposed buildings.
Road alignments.
Retaining structures.
Drainage networks.
Earthworks areas.
Infrastructure corridors.
Instead of reviewing investigation records separately from the project design, teams can visualise both together.
This creates a clearer understanding of how site conditions relate to the proposed development.
Field crews collect information onsite.
Engineers analyse information in the office.
Project managers coordinate activities.
Clients review outcomes.
The challenge is ensuring everybody works from the same information.
Traditional workflows often involve transferring notes, photos and records back into office systems after field work is complete.
This process can be slow and introduces opportunities for information to be missed.
Capturing records directly against locations helps project teams access information sooner and maintain a more complete project record.
Geotechnical engineers use location-based information across many project types, including:
Regardless of project type, the common requirement remains the same.
Field information needs to remain connected to the location where it was collected.
Geotechnical projects rely on understanding site conditions across multiple locations.
Boreholes.
Test pits.
Sampling points.
Groundwater observations.
Field notes.
Photographs.
Plans.
Live Site Map provides a shared visual workspace where geotechnical engineers can manage investigation information through maps, satellite imagery and plan overlays.
Because every field record tells part of the story.
Understanding the full story requires knowing both what the information is and where it came from.
If you have any further questions or need assistance with Live Site Map, feel free to reach out to us anytime

If you have any further questions or need assistance with Akaunt, feel free to reach out to us anytime


